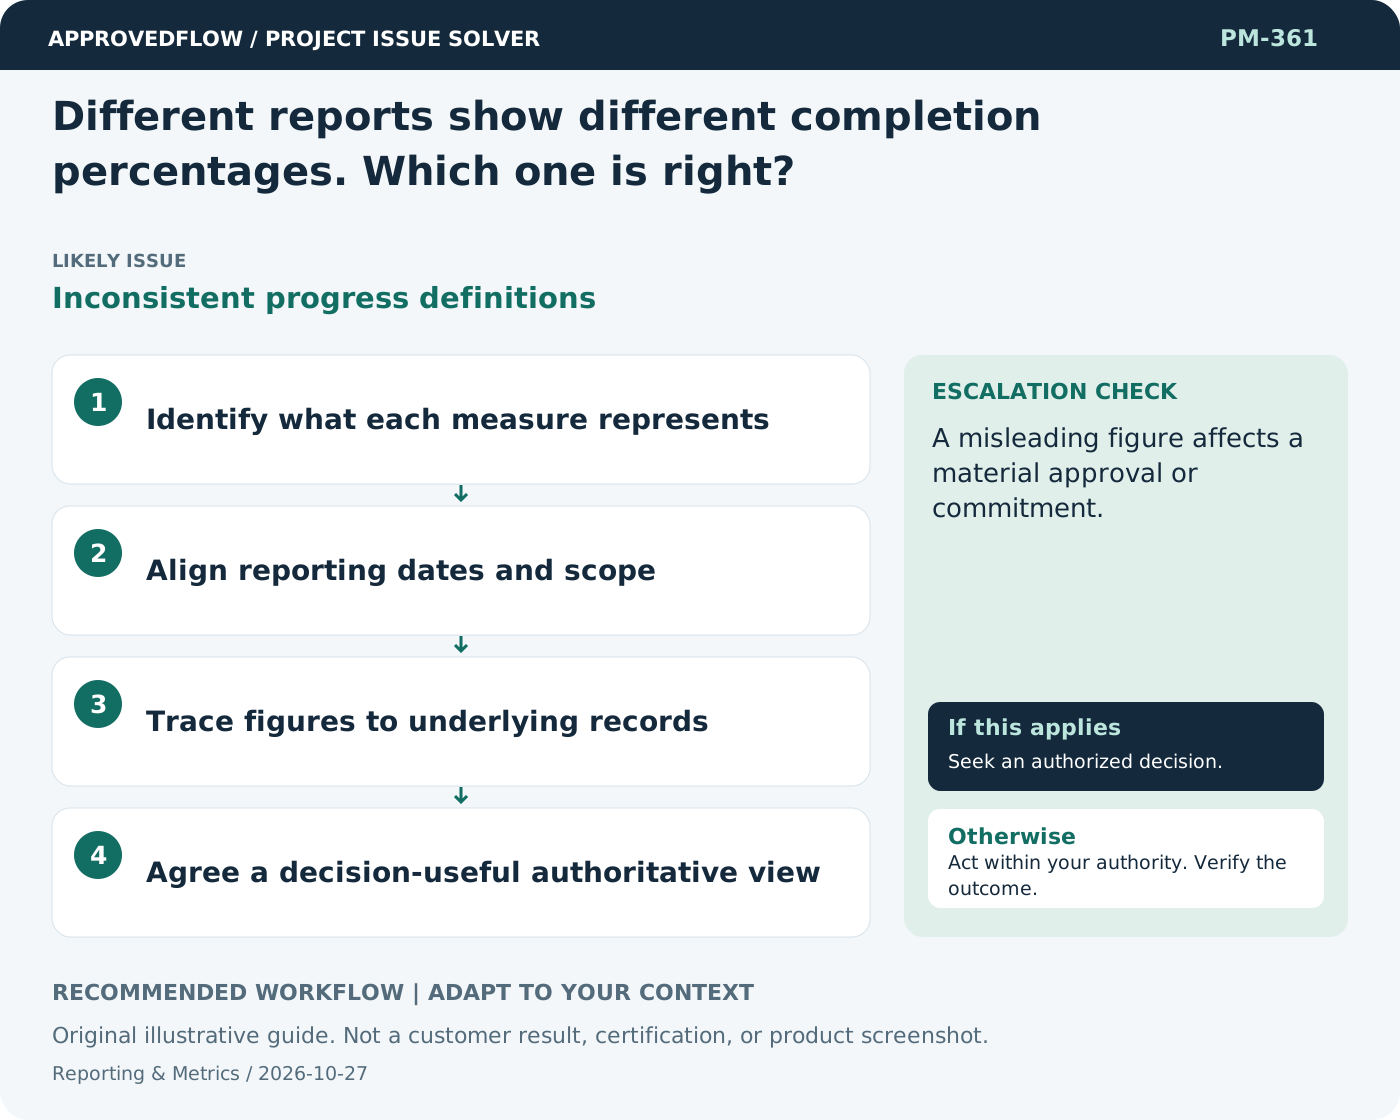
Different reports show different completion percentages. Which one is right?
Inconsistent progress definitionsReconcile definitions, scope, dates, and source data before choosing a number. Different percentages may describe different things, such as effort spent, tasks closed, or accepted outputs.
What to do now
- Identify what each measure represents
- Align reporting dates and scope
- Trace figures to underlying records
- Agree a decision-useful authoritative view
When to escalate
A misleading figure affects a material approval or commitment.
The metric owner and relevant decision maker
Example
One report counts closed tasks while another counts accepted deliverables, so the distinction is made explicit.
Mistake to avoid
Selecting the most favorable percentage without examining its basis.
Prevent a repeat
Check data freshness and meaning, and verify that the measure improves decisions rather than encouraging cosmetic progress.
Suggested ApprovedFlow setup
- Projects
- Tasks
- Timesheets
- Documents
Use the underlying named records and evidence when explaining a metric; validate any dashboard behavior against the current implementation. See the platform
Related cases
- Our reports are always a week old. How should we show that?Hidden data freshness
- How do we show uncertainty in a dashboard?False precision
- How do we show agile progress to executives without misleading percentages?Outcome-focused adaptive reporting
- Our projects report different status definitions. How do we standardize?Inconsistent portfolio signals