Our portfolio dashboard averages all project percentages. Is that meaningful?
Misleading portfolio aggregationDifferent projects have different sizes, uncertainty, and definitions of completion. Use outcome, milestone, exposure, and capacity views that support decisions rather than an arbitrary average.
What to do now
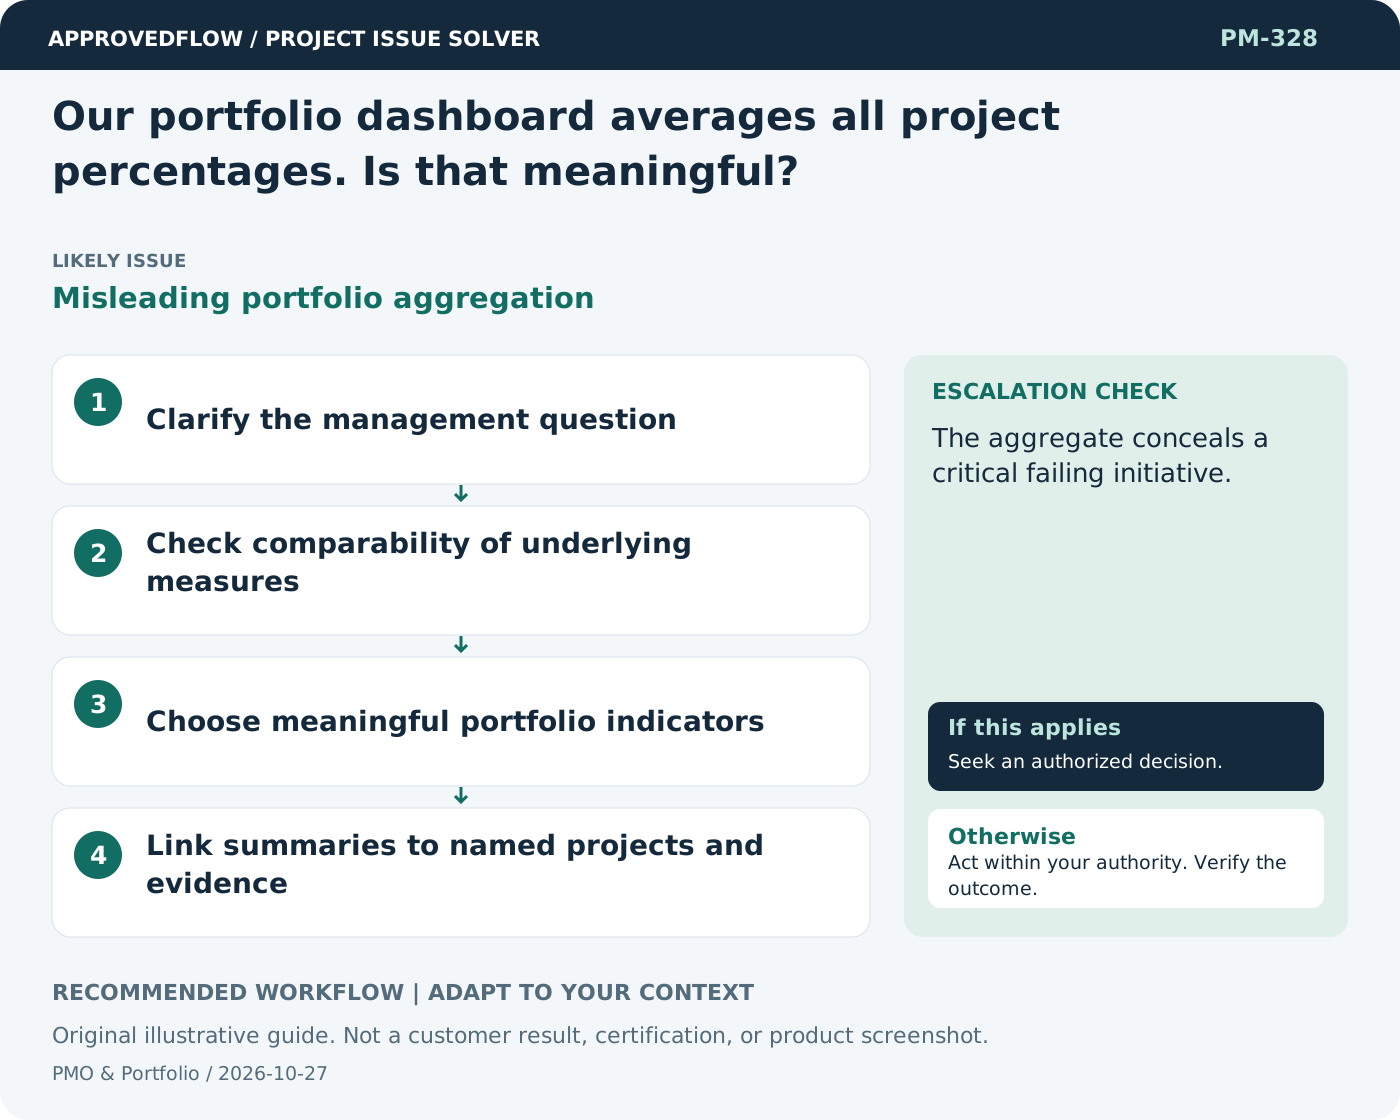
- Clarify the management question
- Check comparability of underlying measures
- Choose meaningful portfolio indicators
- Link summaries to named projects and evidence
When to escalate
Escalate when
The aggregate conceals a critical failing initiative.
Who decides
The portfolio decision authority
Example
A dashboard highlights threatened outcomes and unresolved decisions rather than one overall completion number.
Mistake to avoid
Averaging ten subjective completion percentages and calling it portfolio health.
Prevent a repeat
Review whether active commitments fit available capacity and current priorities rather than just tracking project counts.
Suggested ApprovedFlow setup
- Projects
- Resources
- Documents
- Approvals
Use project and capacity records to support portfolio decisions, then record approved priorities and consequences explicitly. See the platform
Related cases
- How do we maintain a useful project inventory?Unreliable portfolio baseline
- Every project is marked strategic. How do we prioritize meaningfully?Unselective strategic classification
- How do we show agile progress to executives without misleading percentages?Outcome-focused adaptive reporting
- Management wants an adoption percentage. What should I measure?Ambiguous adoption metric